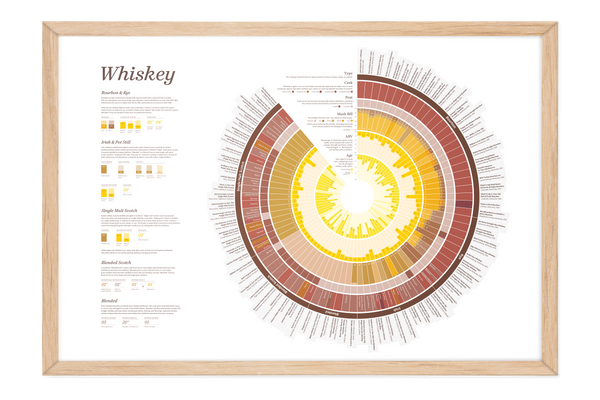
Whiskey Chart
Sold out
$ 32.00
Data Visualization print showing the seasonal harvest of fruits and vegetables across the Northeast United States. The Harvest Chart uses crop harvest data from the USDA to show the weekly percentage of each crop’s seasonal yield, revealing what produce is in season for each week of the year.